Sexual Orientation Stats In The United States (Infographic)
August 13, 2014 by Justin Lehmiller
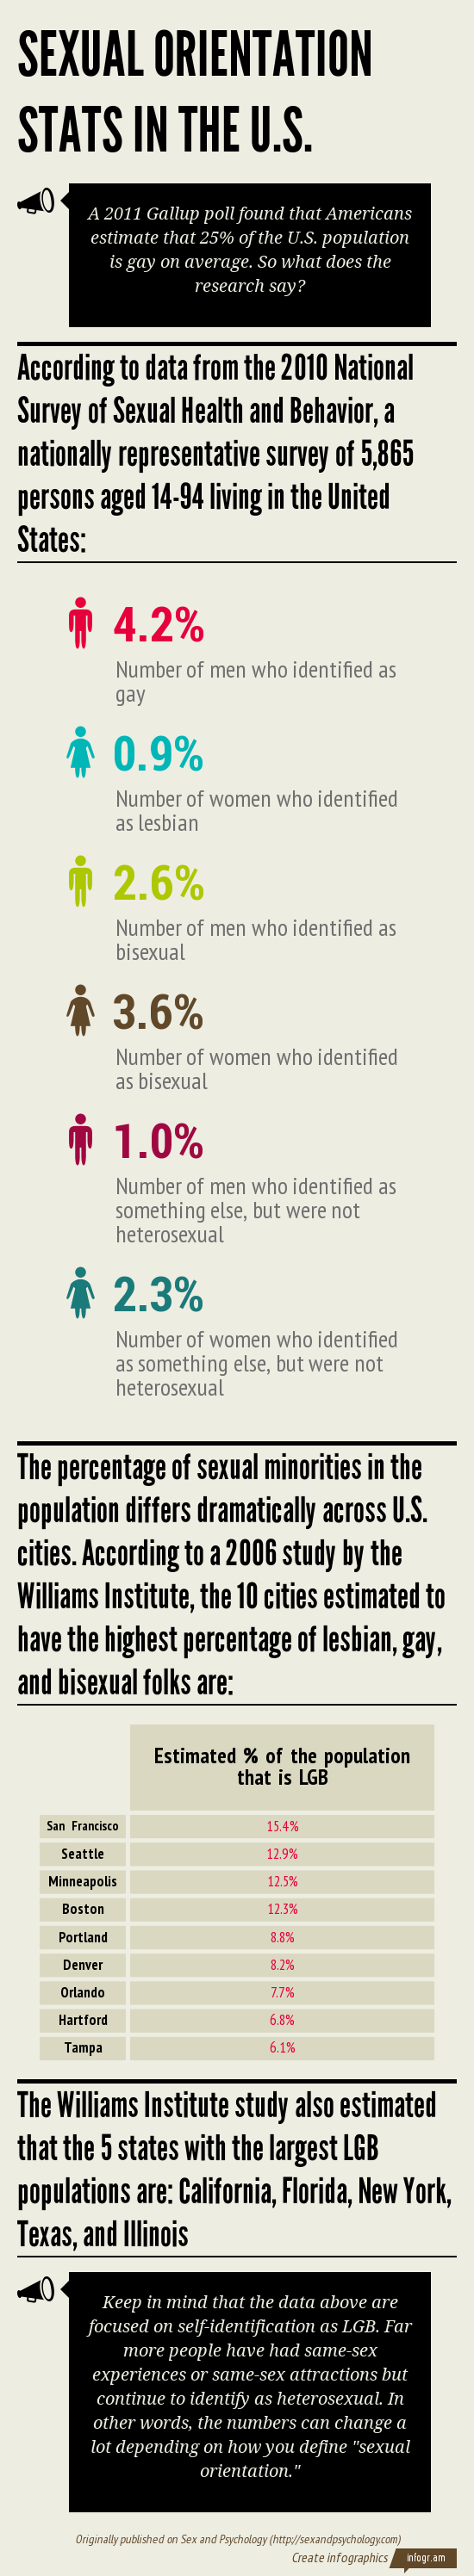
One of the most common questions I receive about sexual orientation concerns the percentage of the population that is gay, lesbian, or bisexual. People seem to have wildly different ideas about what the answer is, so I created the infographic below to highlight the difference between what people think and what the research actually says.
For other infographics about sex, click here.
Want to learn more about Sex and Psychology ? Click here for previous articles or follow the blog on Facebook (facebook.com/psychologyofsex), Twitter (@JustinLehmiller), or Reddit (reddit.com/r/psychologyofsex) to receive updates.
Image Source: iStockphoto

Dr. Justin Lehmiller
Founder & Owner of Sex and PsychologyDr. Justin Lehmiller is a social psychologist and Research Fellow at The Kinsey Institute. He runs the Sex and Psychology blog and podcast and is author of the popular book Tell Me What You Want. Dr. Lehmiller is an award-winning educator, and a prolific researcher who has published more than 50 academic works.
Read full bio >